Representing chronograms in Notepad started to get confusing.
While searching for a graphic editor, I discovered Wavedrom . It's a js application able to parse specially crafted JSON files to render chronograms as SVG.
The waves are defined as strings, where each character represents a "block". So switching from the text drawings I had to that particular format was quick and easy.
The amount of SVG data generated can cause performance issues, so I might fork it to adjust some stuff for big chronogram sheets: mainly prevent automatic refresh (slow), adding more colors and also half-clock transitions. Will see where that goes...
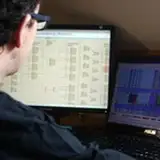
In the meantime, enjoy the screenshot ;)
It represents most of what's going on just before and after a new video line starts. Graphics prefetch is done while CHBL is high, then active display starts.
The file with a few comments is found here: https://github.com/neogeodev/NeoGeoFPGA-sim/blob/master/wavedrom.json
I also wanted to thank everyone for their help. I'll be buying the first components for the validation board mid-April (FPGA, SRAM and flash). They'll come from Digikey, so I guess that a large portion of March's pledges will go to them (and to the customs office...).
I'm looking at the XC6SLX16-2FTG256, but I'm still not sure if I want to try HDMI or not. If so, I'll need either more I/Os to hook up an SDRAM framebuffer, or a magic analog-to-HDMI chip from Analog Devices. I certainly don't want to hack up the rendering logic to generate HDMI directly.